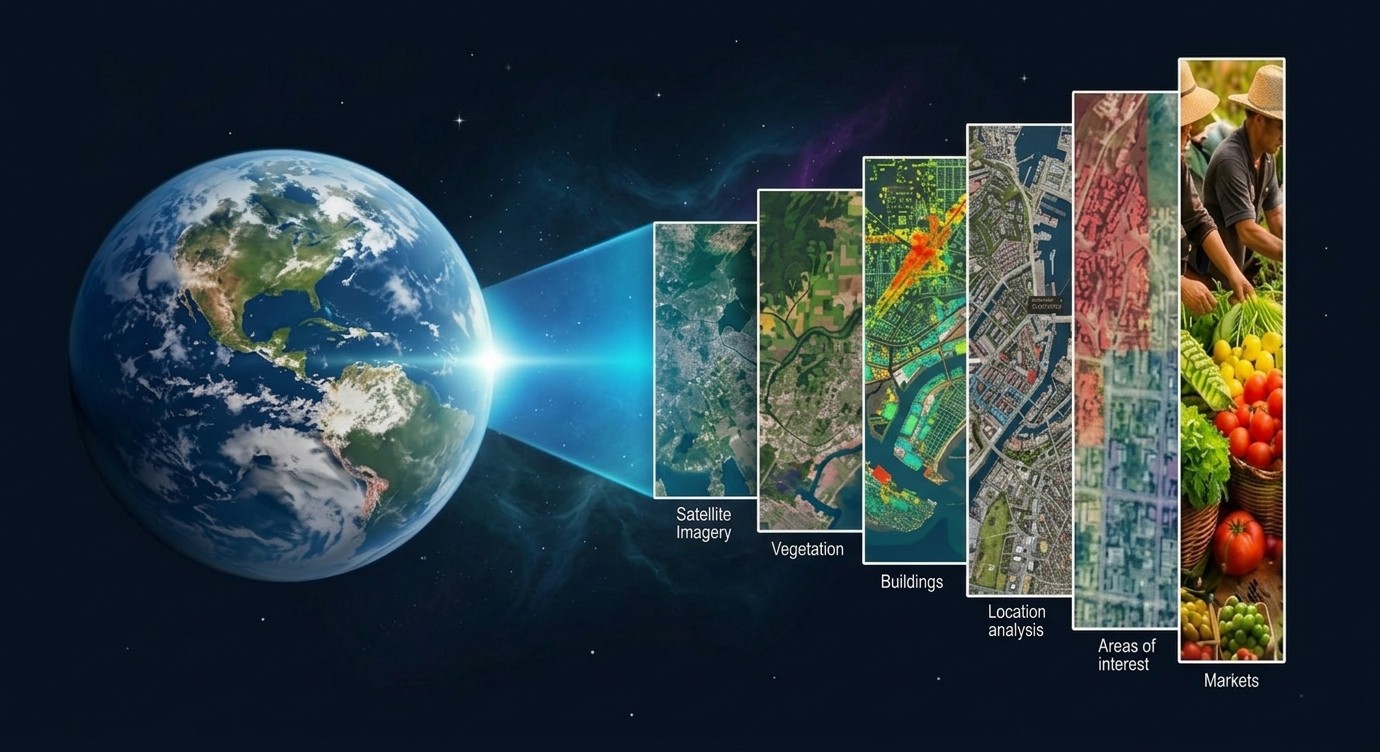
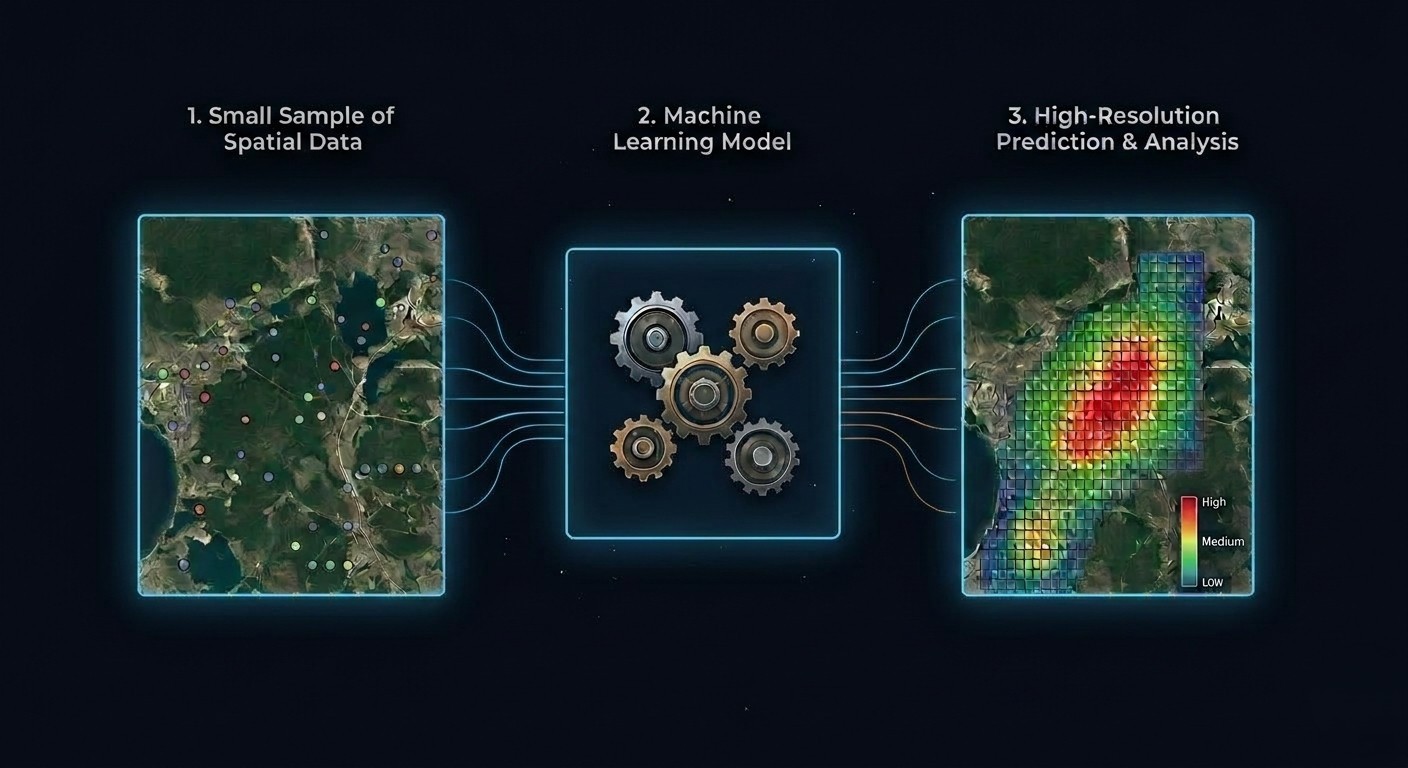
We generate local, high-resolution knowledge about the indicator or outcome you care about — mapped at city, country, or global scale. Our models combine sampled survey data with satellite imagery to reveal patterns invisible to traditional methods.
ClientGovernment of Mozambique & World Bank
TaskTargeting of anti-poverty and public investments.
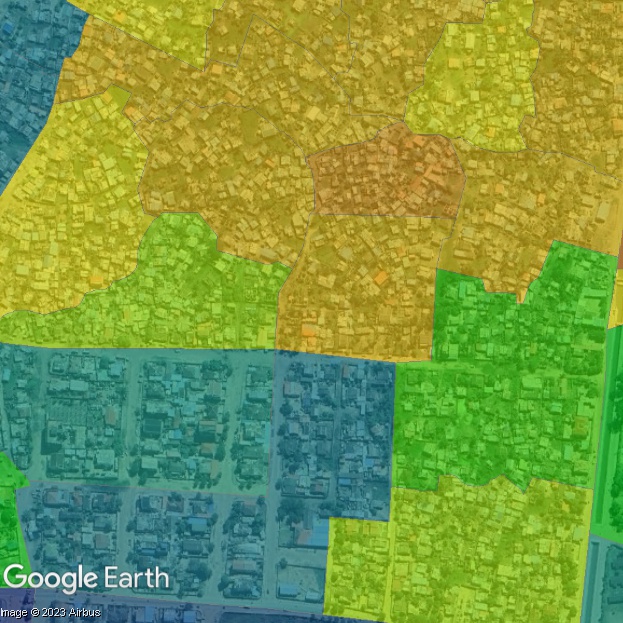
FindingsNeighborhood-level poverty was estimated across urban Mozambique using satellite imagery, machine learning, and census data. The resulting maps identified where the urban poor are concentrated and were used by the Government of Mozambique to guide the expansion of its urban social safety net program (PASP).
ClientGovernment of Ethiopia & World Bank
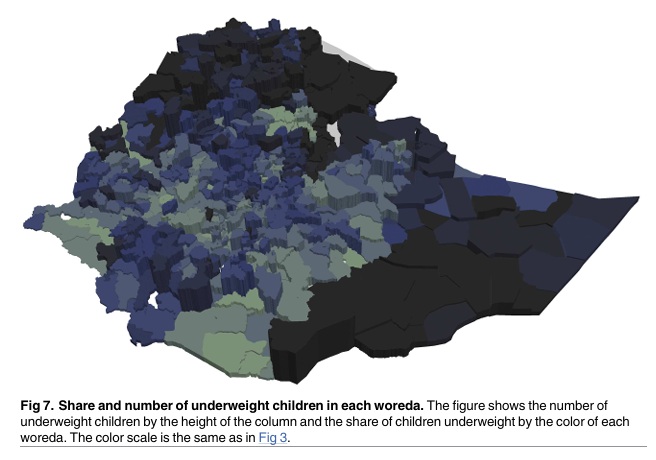
TaskGenerating maps of malnutrition (underweight, stunting, BMI) at local level used for targeting of interventions related to nutrition and health.
FindingsWoreda-level estimates of child stunting and underweight were generated for all of Ethiopia using small area estimation. The maps revealed large variation in undernutrition within regions and showed that geographical targeting based on these estimates is a viable strategy for improving the reach of nutrition interventions.
ClientInternational Growth Center (IGC) & Kampala Capital City Authority (KCCA)
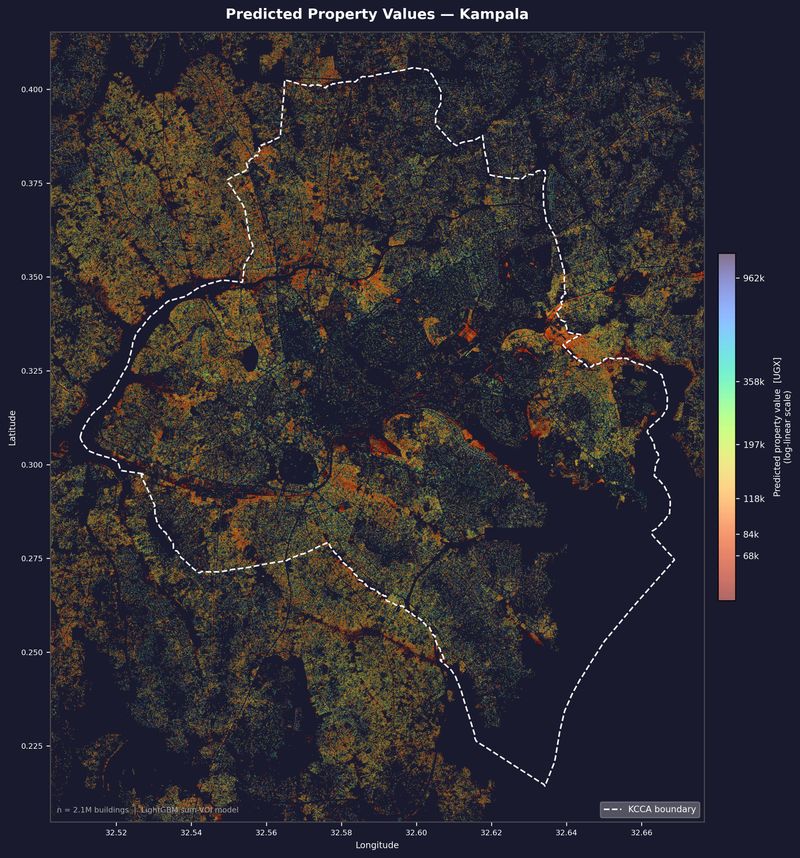
TaskPredicting property values for all buildings in the Kampala agglomeration to support tax collection, infrastructure planning, and poverty analysis.
FindingsBuilding-level property values were predicted for all 2.1 million buildings across the Kampala agglomeration using a gradient-boosted decision tree model trained on satellite and geospatial data. The model learned from 172,000 officially assessed buildings, combining building footprint size and shape, nighttime light intensity, vegetation cover, building height, and proximity to roads, schools, and other amenities. Cross-validation showed the model correctly ranks buildings by value in 76 out of 100 cases. The resulting city-wide property value surface — the first of its kind for Kampala — reveals sharp contrasts between high-value commercial corridors and dense informal settlements, and supports fairer property tax collection, targeted infrastructure investment, urban planning, and neighbourhood-level poverty analysis.
ClientGovernment of The Dominican Republic & World Bank
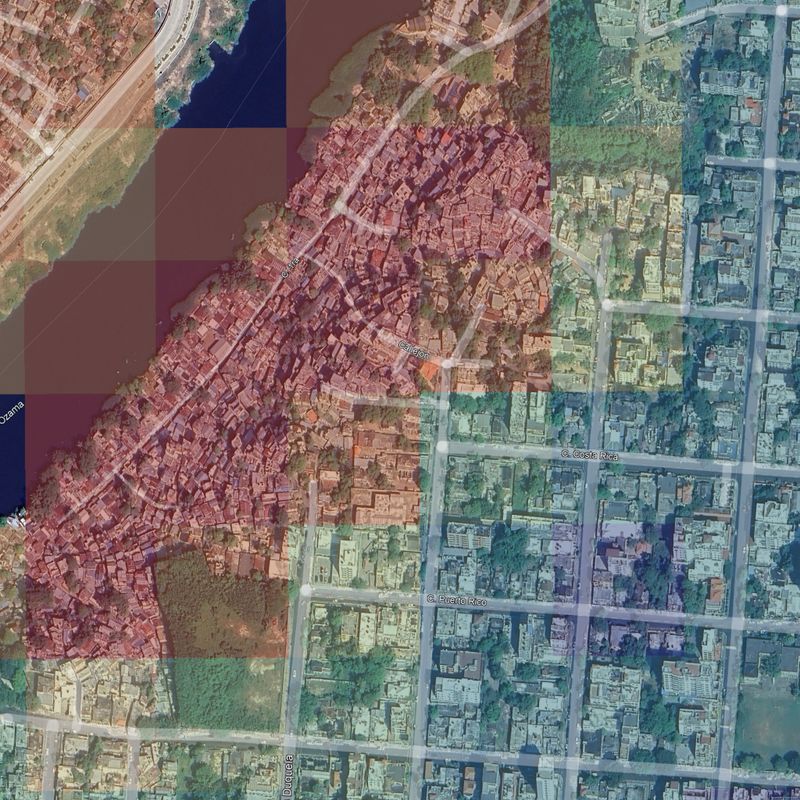
TaskInforming the Government and national statistical office on the distribution of high and low living conditions.
FindingsHigh-resolution welfare maps of Greater Santo Domingo were produced at 100m grid cells using machine learning and geo-spatial data including building footprints, nighttime lights, and road networks. The maps support the World Bank's climate-smart housing strategy by identifying where the most vulnerable populations are located.
ClientGovernment of Ethiopia & World Bank
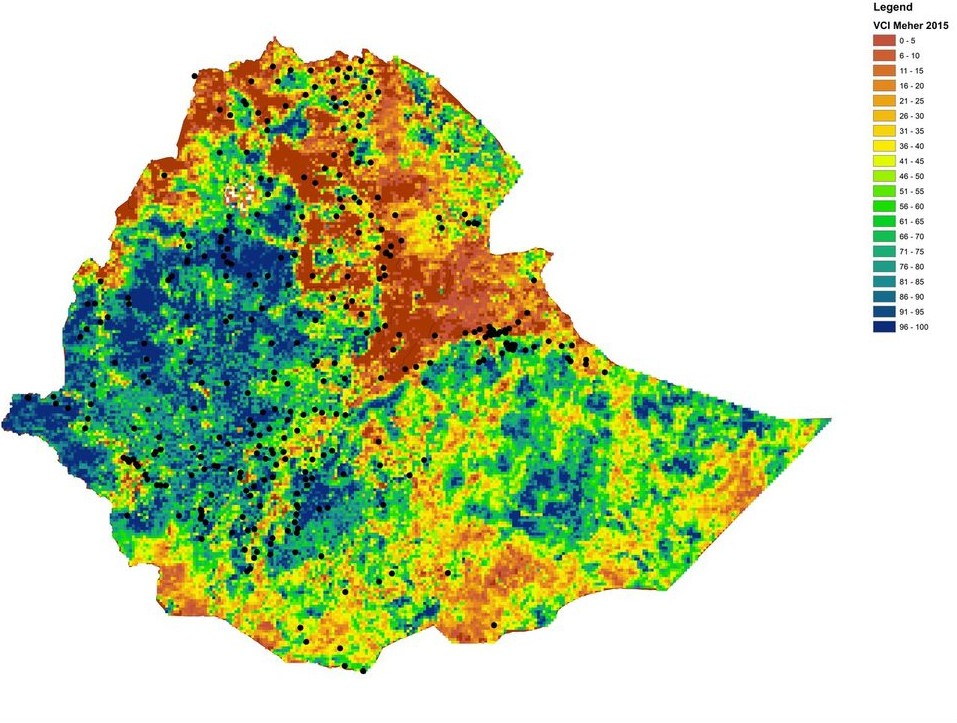
TaskShowcasing the quality of drought measures and assessing drought exposure and impact on the ground.
FindingsDespite the 2015 drought being reported as the worst in five decades, different satellite-based indicators gave contradictory pictures of where the drought was most severe and whether it led to agricultural losses. The study found limited spatial correlation between drought measures and called for more care in using them for socioeconomic analysis. Separately, no widespread increase in child undernutrition was found following the drought — except in areas with limited road infrastructure, suggesting that Ethiopia's investments in roads may have strengthened resilience.
ClientNational Statistical Office (INE) of Angola & World Bank
TaskTraining the national statistical office on the processing, analysis and mapping of spatial data.
FindingsA team at INE Angola was trained in the use of statistical software, poverty mapping techniques, and analysis of census data, building lasting in-house capacity for spatial analytics and evidence-based policy work.
ClientWorld Bank & Government of Pakistan
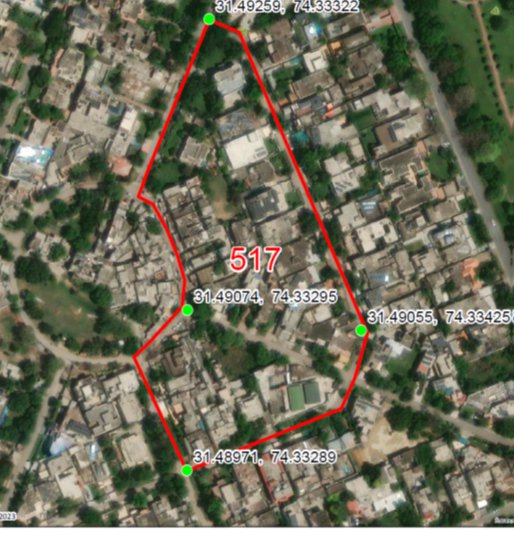
TaskIdentifying areas with low coverage of the National Socio-Economic Registry (NSER), enabling targeted enrollment campaigns.
FindingsCoverage of Pakistan's national registry was estimated at Union Council level using machine learning and satellite data. Nighttime light intensity was the strongest predictor, followed by building density and NSER database records. The model identified areas with low registration rates, providing actionable maps for directing enrollment efforts to underserved communities.
ClientUNDP & Government of Botswana
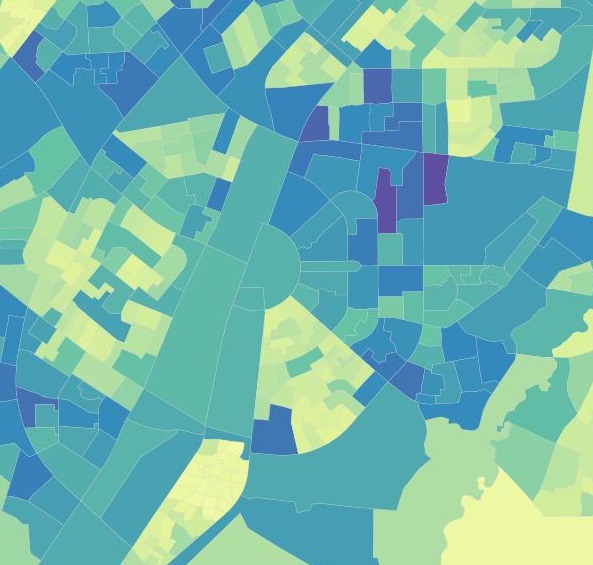
TaskInforming policy makers and the UN about potential target areas for interventions.
FindingsIncome was estimated at census enumeration area level across Botswana using anonymized mobile phone records combined with satellite data, building footprints, and road networks. The model achieved strong predictive accuracy, with average building size and nighttime lights as the most important predictors. The resulting maps reveal large welfare variation within districts and enable tracking of spatial inequality over time.
ClientResearch community
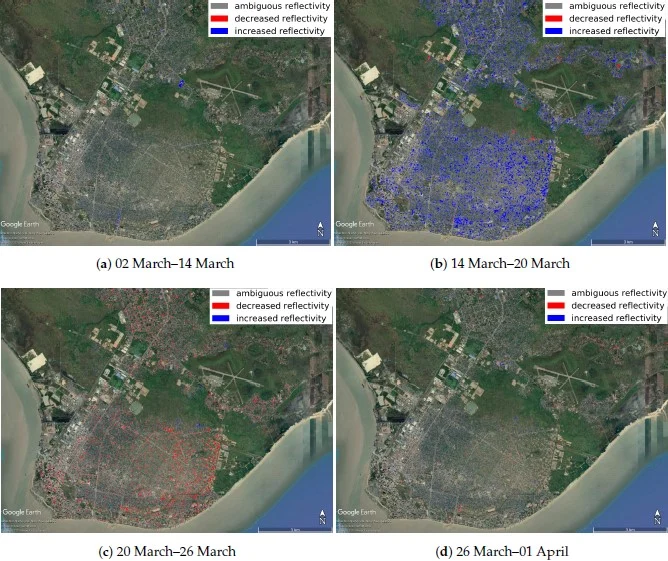
TaskFast assessment of cyclone damage using radar signals, when satellite images still not available due to cloud coverage and winds are too strong for drones.
FindingsSAR change detection from Sentinel-1 captured cyclone Idai's impact on Beira within 12 hours of first impact — weeks before optical imagery became available. Filtering by building footprints focused the analysis on damage to houses rather than the natural environment, and the resulting damage maps correlated with manually tagged assessments. The method offers a cost-effective and rapid first indication of cyclone destruction for emergency response.
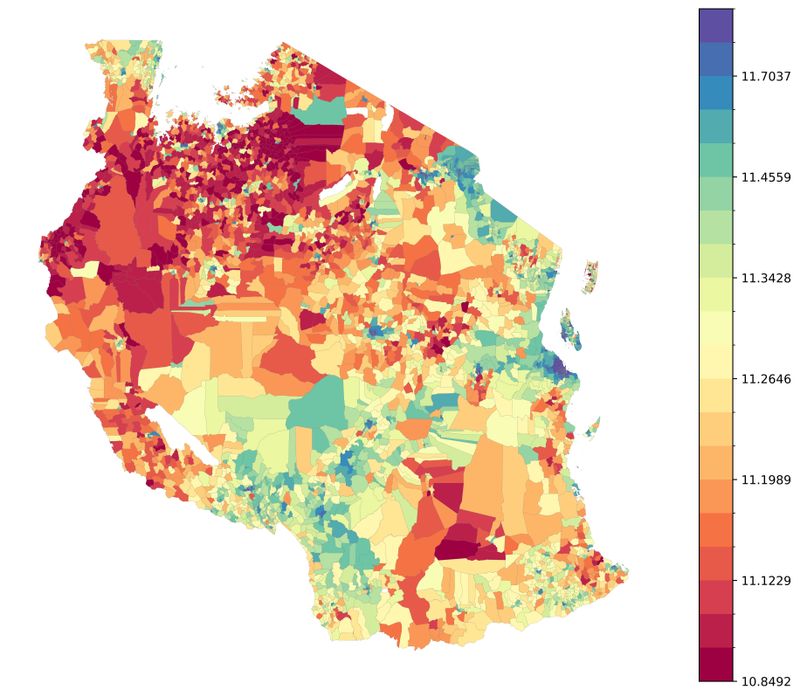
ClientGovernment of Tanzania & World Bank
TaskSpatial identification of social protection beneficiaries eligible for graduation from the program.
FindingsWard-level PMT scores were estimated for all PSSN-enrolled households across Tanzania by combining nearly 2.8 million household observations with satellite nighttime light data. Changes in nighttime lights over time were used to predict current welfare levels for households enrolled years earlier. The resulting maps ranked all wards by average PMT score and number of households in the upper quintile, enabling TASAF to geographically target areas where households are most likely ready for graduation from the social safety net program.
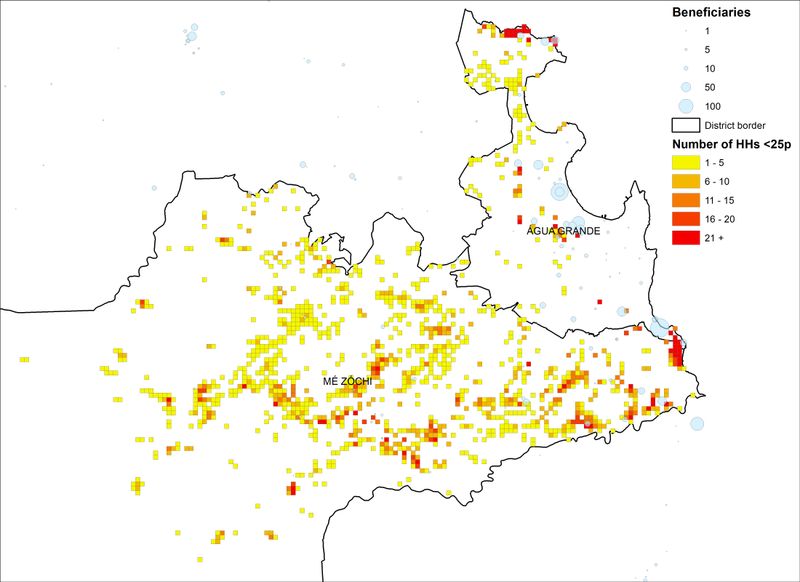
ClientGovernment of São Tomé and Príncipe & World Bank
TaskOverview of climate risks, poverty, and public infrastructure for future investments.
FindingsHigh-resolution poverty maps were produced for all of São Tomé and Príncipe at 110m x 110m grid cells using machine learning, satellite imagery, and building footprint data including roof color classification. By combining poverty incidence with population density, the maps identified enrollment entry points for rapid expansion of social safety net programs. Overlaying the poverty maps with climate hazard data further revealed which poor households are most exposed to drought and flash floods, supporting adaptive social protection planning.
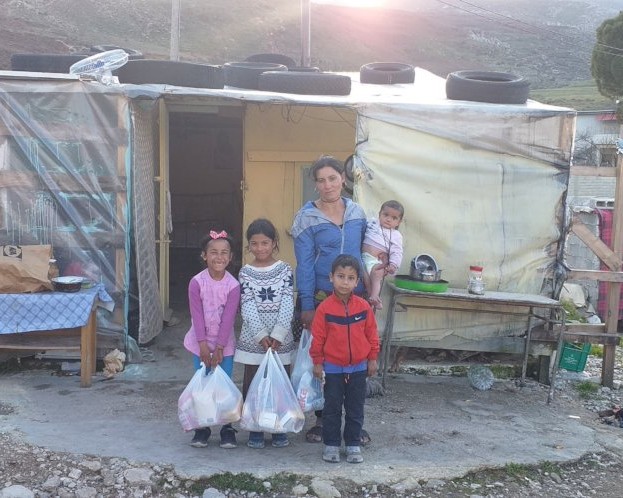
ClientGovernment of Albania & World Bank
TaskGuiding policies and targeting of interventions.
FindingsCommune-level poverty and inequality were estimated across Albania by combining the 2012 Living Standards Measurement Study survey with the 2011 census. The maps revealed large regional disparities in welfare, shaped in part by internal migration flows toward Tirana that led to rapid urbanization in some areas and depopulation in others. The results provide policy makers with a detailed picture of local poverty to guide targeting of interventions.
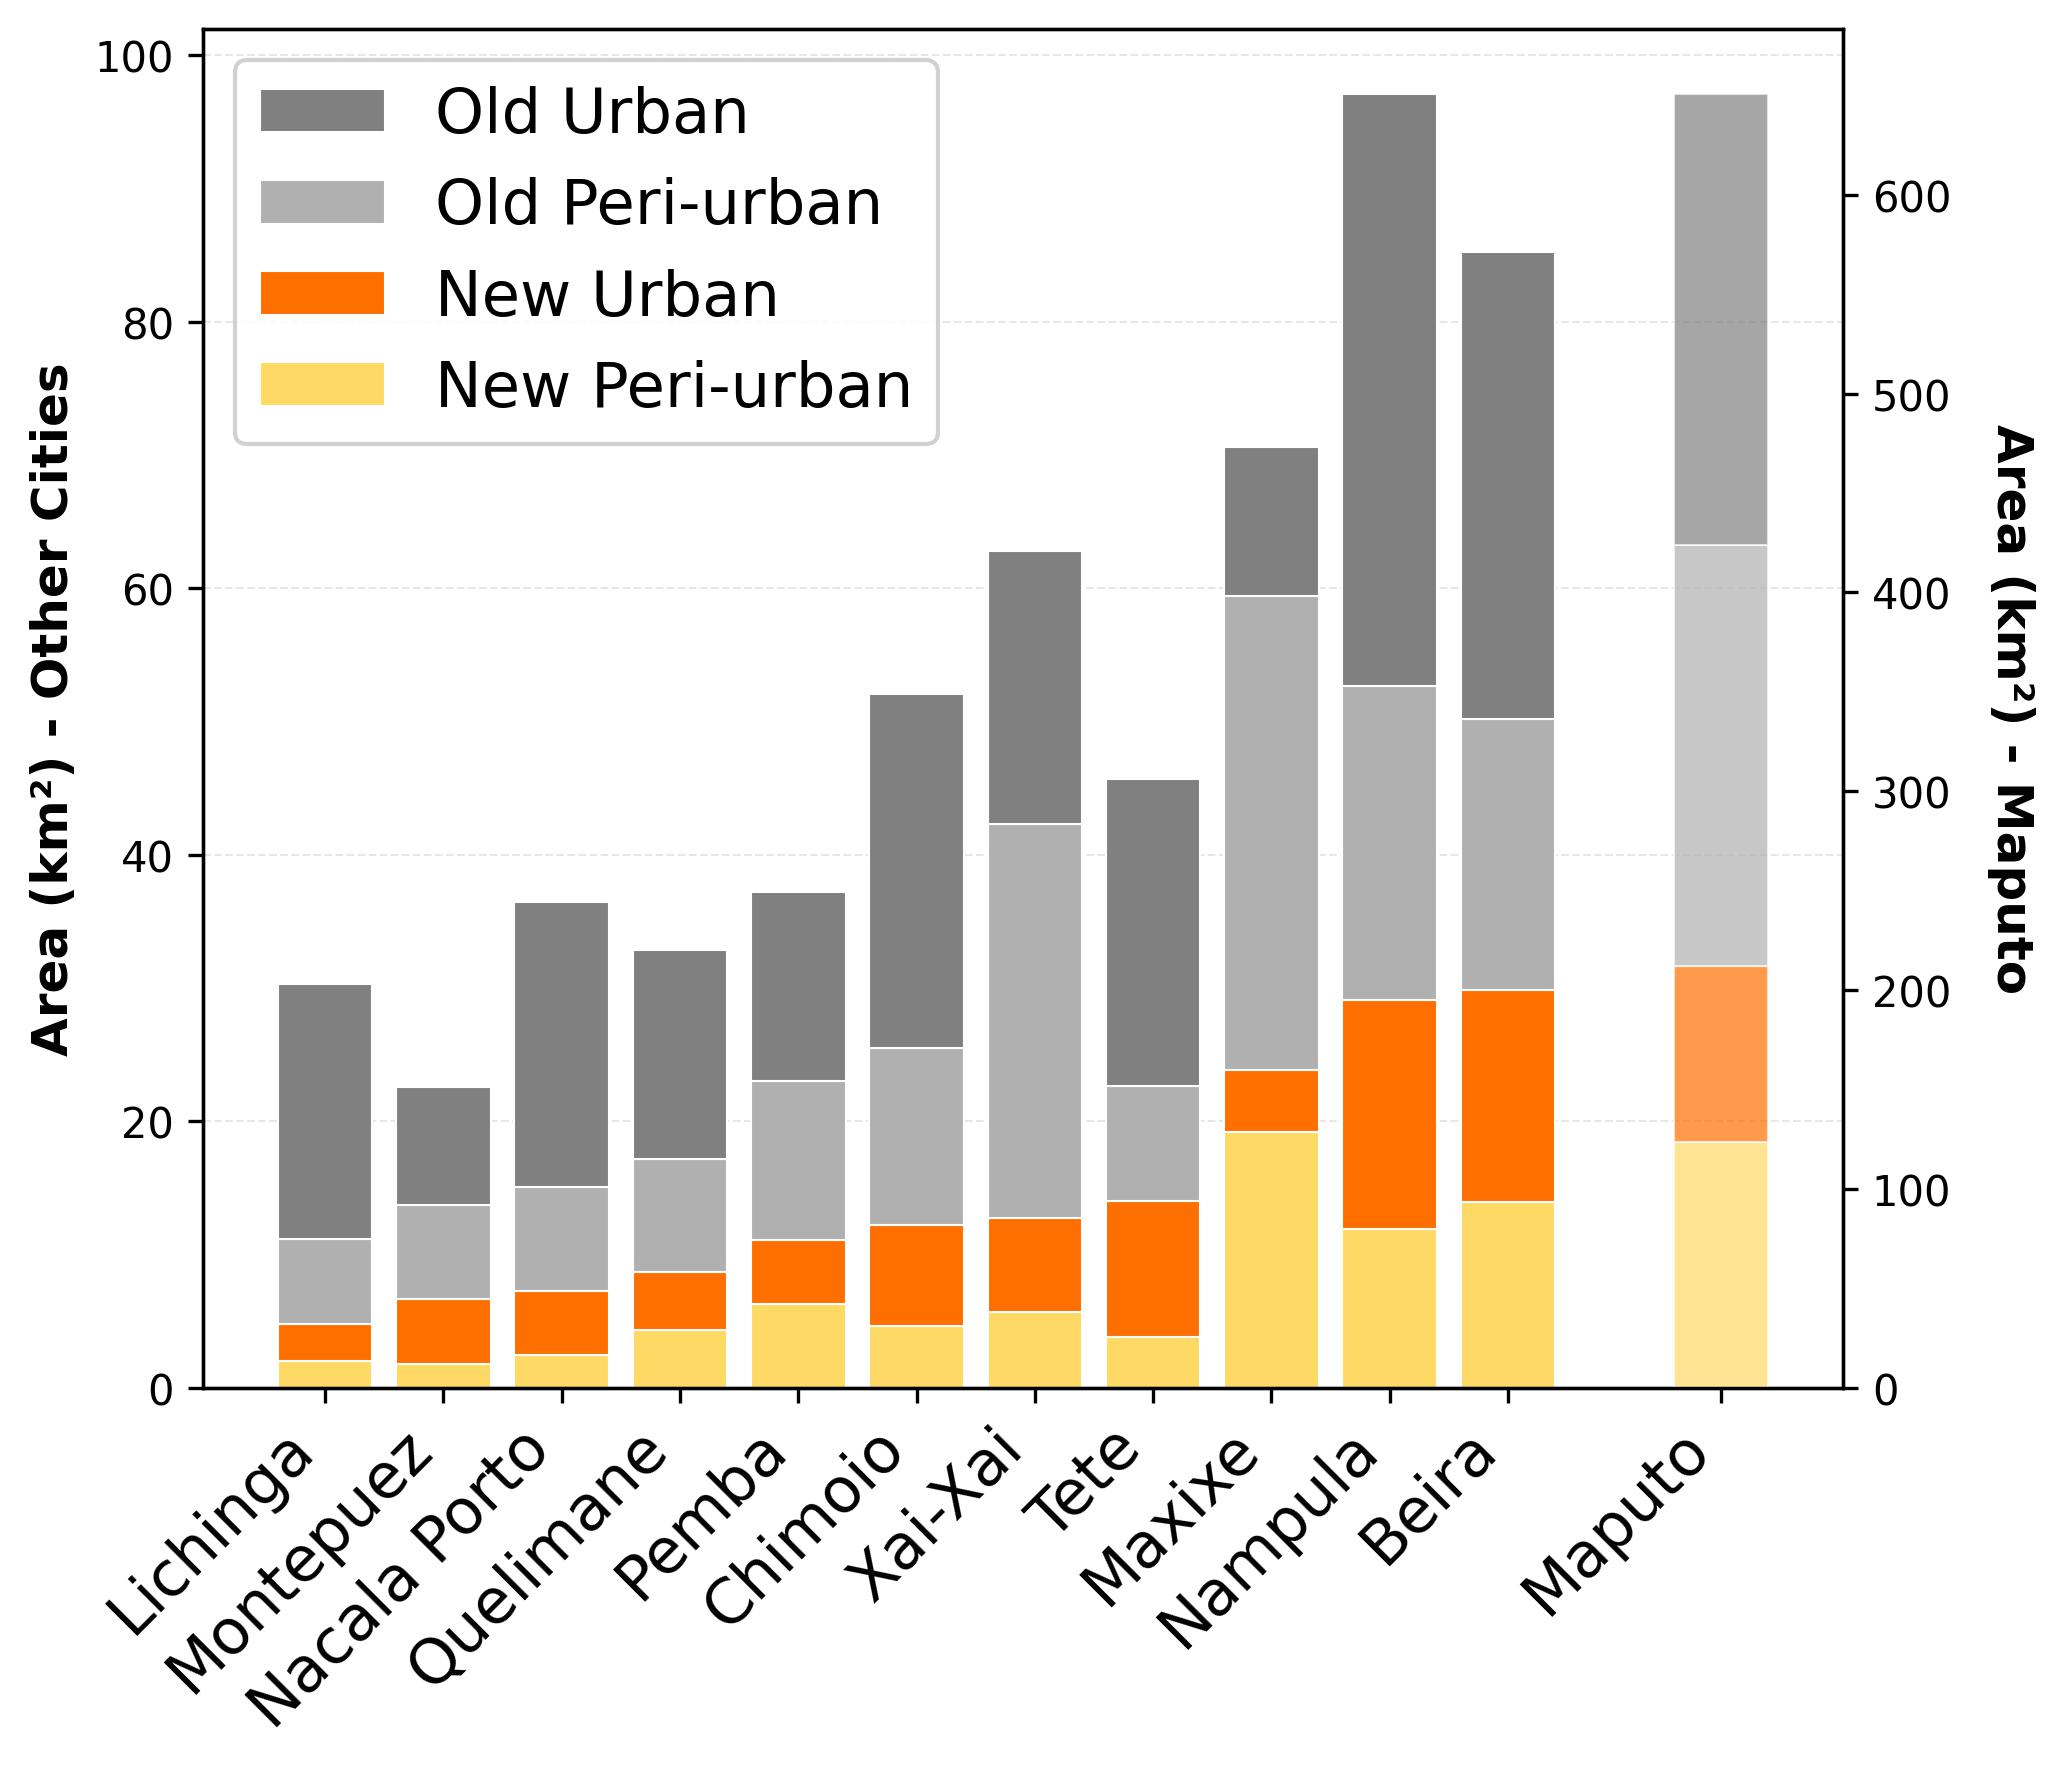
ClientWorld Bank
TaskAssessing urban and peri-urban growth patterns and their relationship with household welfare.
FindingsUrban and peri-urban growth was tracked across twelve major Mozambican cities between 2015 and 2022 using building footprint data from Google Open Buildings and household survey data. A building density classification at 100m grid cells identified four zone types — established urban, newly urbanized, established peri-urban, and recently developed peri-urban. All twelve cities experienced real consumption declines over the period, with established urban zones showing the largest drops and peri-urban zones the smallest, highlighting the complexity of welfare dynamics in rapidly expanding urban areas.
ClientSpacepilots initiative: estimates developed in-house and available to partners
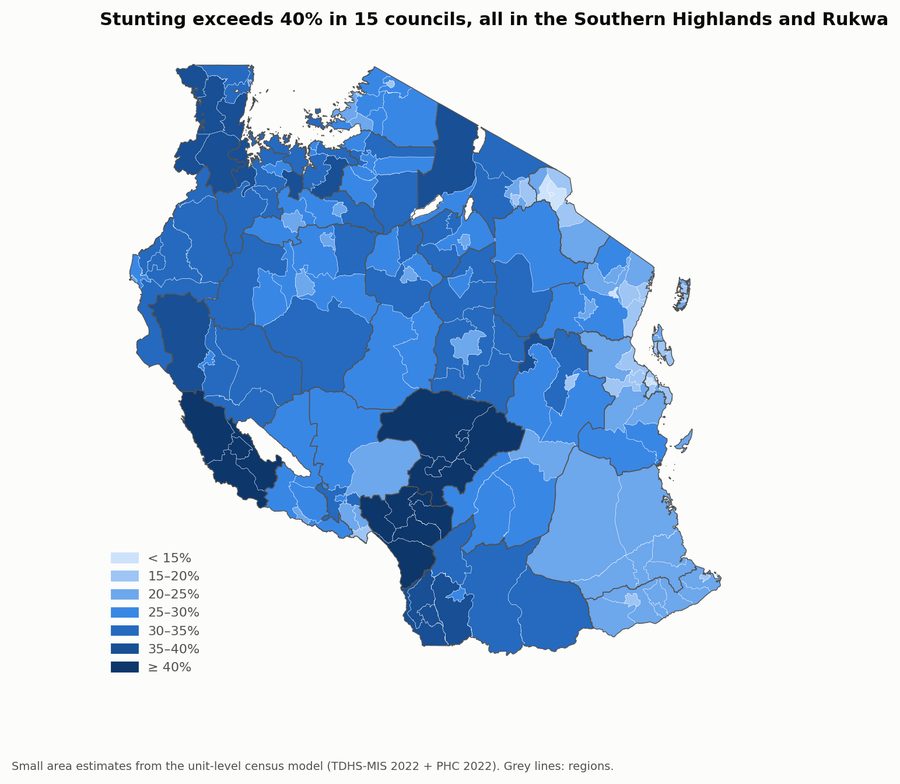
TaskEstimating child stunting, severe stunting and height-for-age for every council, district and region of Tanzania, for ranking and targeting councils and sizing nutrition programmes.
FindingsCouncil-level estimates were produced for all 195 councils by combining the 2022 Demographic and Health Survey with the 2022 census and satellite data. Stunting exceeds 30% in 74 councils and varies more than fivefold, from 11% in Moshi to 58% in Kilolo. An estimated 2.7 million children under 5 are stunted. The highest rates are in Iringa, Njombe and Rukwa, but the largest numbers of stunted children are in populous councils of the Lake Zone and the west, so targeting by rate and by numbers points to different places.
DataThe preview report sets out the approach, main findings and quality of the estimates. The full report and data package, with estimates and confidence intervals for every council, district and region and experimental ward estimates, are available on request. © Spacepilots 2026; not to be reproduced without permission.